back to County Voting Patterns in US Presidential Elections, 1976-2000
Go directly to main map
Voting with the Winner
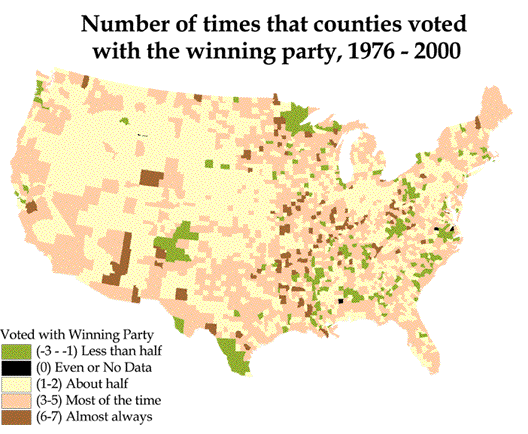
Next, we performed an analysis showing how well each county's vote results correlate with the winning party over these seven elections. A new field called withWinner was added to the seven shapefile's tables. See Table 4 for the values that were added to selected records.
Table 4
| Election Year | Winning Party | voteCode value | withWinner result |
|---|
| 1976 | Democrat | D | 1 |
| | | R | -1 |
| 1980 | Republican | D | -1 |
| | | R | 1 |
| 1984 | Republican | D | -1 |
| | | R | 1 |
| 1988 | Republican | D | -1 |
| | | R | 1 |
| 1992 | Democrat | D | 1 |
| | | R | -1 |
| 1996 | Democrat | D | 1 |
| | | R | -1 |
| 2000 | Republican | D | -1 |
| | | R | 1 |
| All Years | | I | 0 |
| | | N | 0 |
Again we used Query Builder to select records and Map Calculator to populate cells in selected records. Click here to see the seven individual maps. (Scroll down for main map.)
Similarly, Map Calculator was used to add up the withWinner values for each cell, producing the map below. Possible values ranged from -7 to 7.

