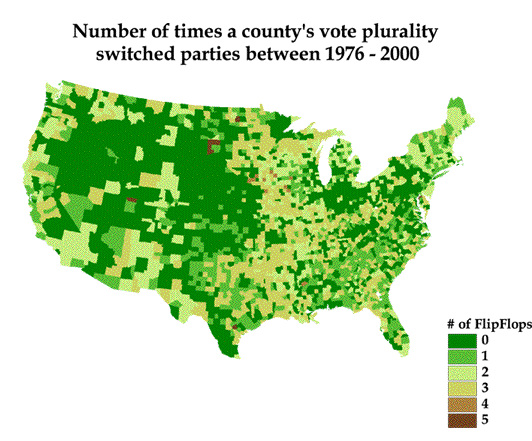
The possible values ranged from 0 (voted for the same party in every election from 1976 to 2000) to 6 (voted for a different party in every election from 1976 to 2000).
We used Map Calculator to perform the function "aGrid.Combine (aGridList)" to take data fields from each of the two grids being compared and place them together in a new grid. The function's format is [gridA].combine({[gridB], [gridC], ... [gridN]}). For example,
([G1976].combine({[G1980]})). The result was a file with four fields:
Value
Count
Gyyyy
Gyyy(y+4)
where Gyyyy was the PartyValue field from the grid (Republican=-1, Democrat=1).
The two PartyValue fields could have 9 possible value pairs, which represent several conditions (see Table 5 for the possible pairs).
| Gyyyy | Gyyyy(+4) | Possible results |
| 1 | 1 | Democrat both elections |
| 1 | 0 | Democrat to Tie or No Data |
| 1 | -1 | Democrat to Republican |
| 0 | 1 | Tie or No Data to Democrat |
| 0 | 0 | Tie or No Data to Tie or No Data |
| 0 | -1 | Tie or No Data to Republican |
| -1 | 1 | Republican to Democrat |
| -1 | 0 | Republican to Tie or No Data |
| -1 | -1 | Republican both elections |
| switchCode | Gyyyy | Gyyy(y+4) | Label |
| 1 | 1 | 1 | Dem |
| 2 | 1 | -1 | Dem to Rep |
| 3 | -1 | -1 | Rep |
| 4 | -1 | 1 | Rep to Dem |
| 5 | One or two zeroes | No Data |
When all six grids were created and coded, Map Calculator was used to add together [( [1976_1980 . switchedParty] + [1980_1984 . switchedParty] + [1984_1988 . switchedParty] + [1988_1992 . switchedParty] + [1996_2000 . switchedParty]) + [1992_1996 . switchedParty]] the switchedParty' fields to yield a new grid showing the number of times each area of the grid changed party allegiance over the past 7 elections (see Figure 7).

The possible values ranged from 0 (voted for the same party in every election from 1976 to 2000) to 6 (voted for a different party in every election from 1976 to 2000).